Yakima River Floodplain
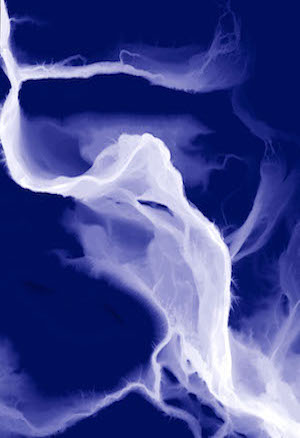
For this analysis, Karen Zeeb and I visualized a segment of the Yakima River by adopting the style and methodology of cartogapher Dan Coe. The process is originally used for planning purposes to delineate channel migration zones. Creating the final product entails subtracting a REM (relative elevation model) from a bare Earth LiDAR DEM (digital elevation model). Washington State's Department of Ecology kindly outlines three detailed methodologies for running these calculations in Appendix E of this report.
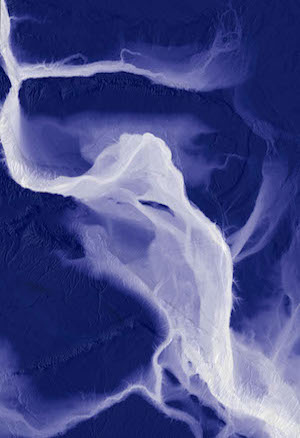
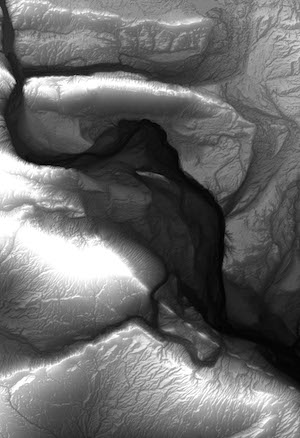
The image on the far left is our final output after photoshop touch-ups. The middle image features the output overlayed on top of the original DEM. The far right image is the orignal DEM with applied hillshading.