Floodplain Visualization - Part II
I wanted to expand on my Floodplain Visualization project by applying the similar methods to different regions of the world. USGS Earth Explorer is a good resource for obtaining DEMs outside of the United States.
Although I ran into geoprocessing errors and not every DEM was the best resolution, I accidentally discovered and made ample use of the "Edit High/Low Values" button in the DEM's symbology in ArcMap (see below).
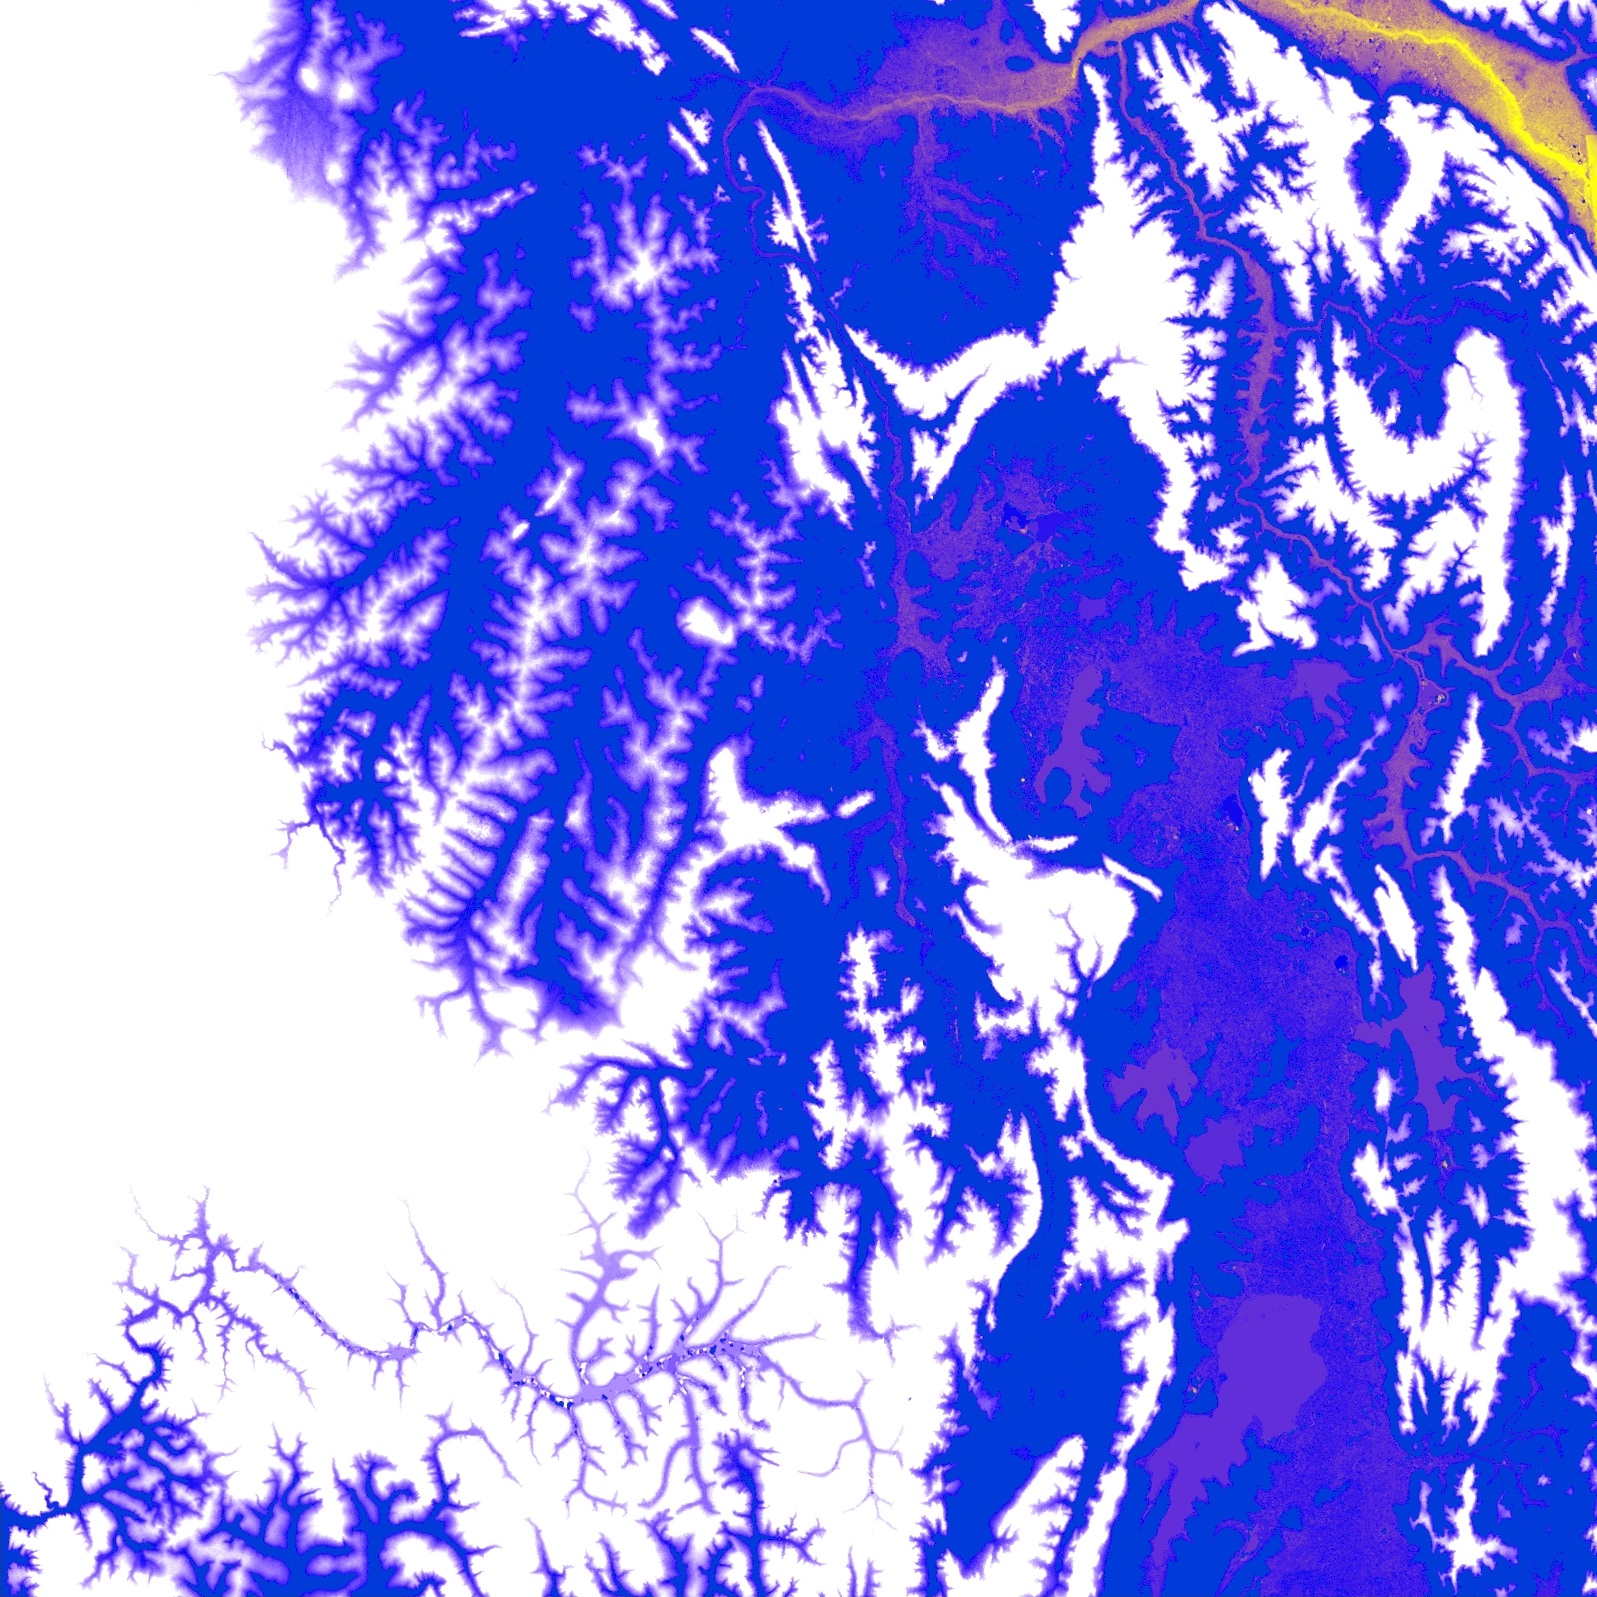
By manually adjusting the range of elevation values and customizing the color ramp, I was able to visually iscolate interesting water features. Much like the process used in my previous floodplain visualization, this process can be very iterative. The product is an artistic portrait of the landscape in line and color.
Click through the images below to see the final visualizations.
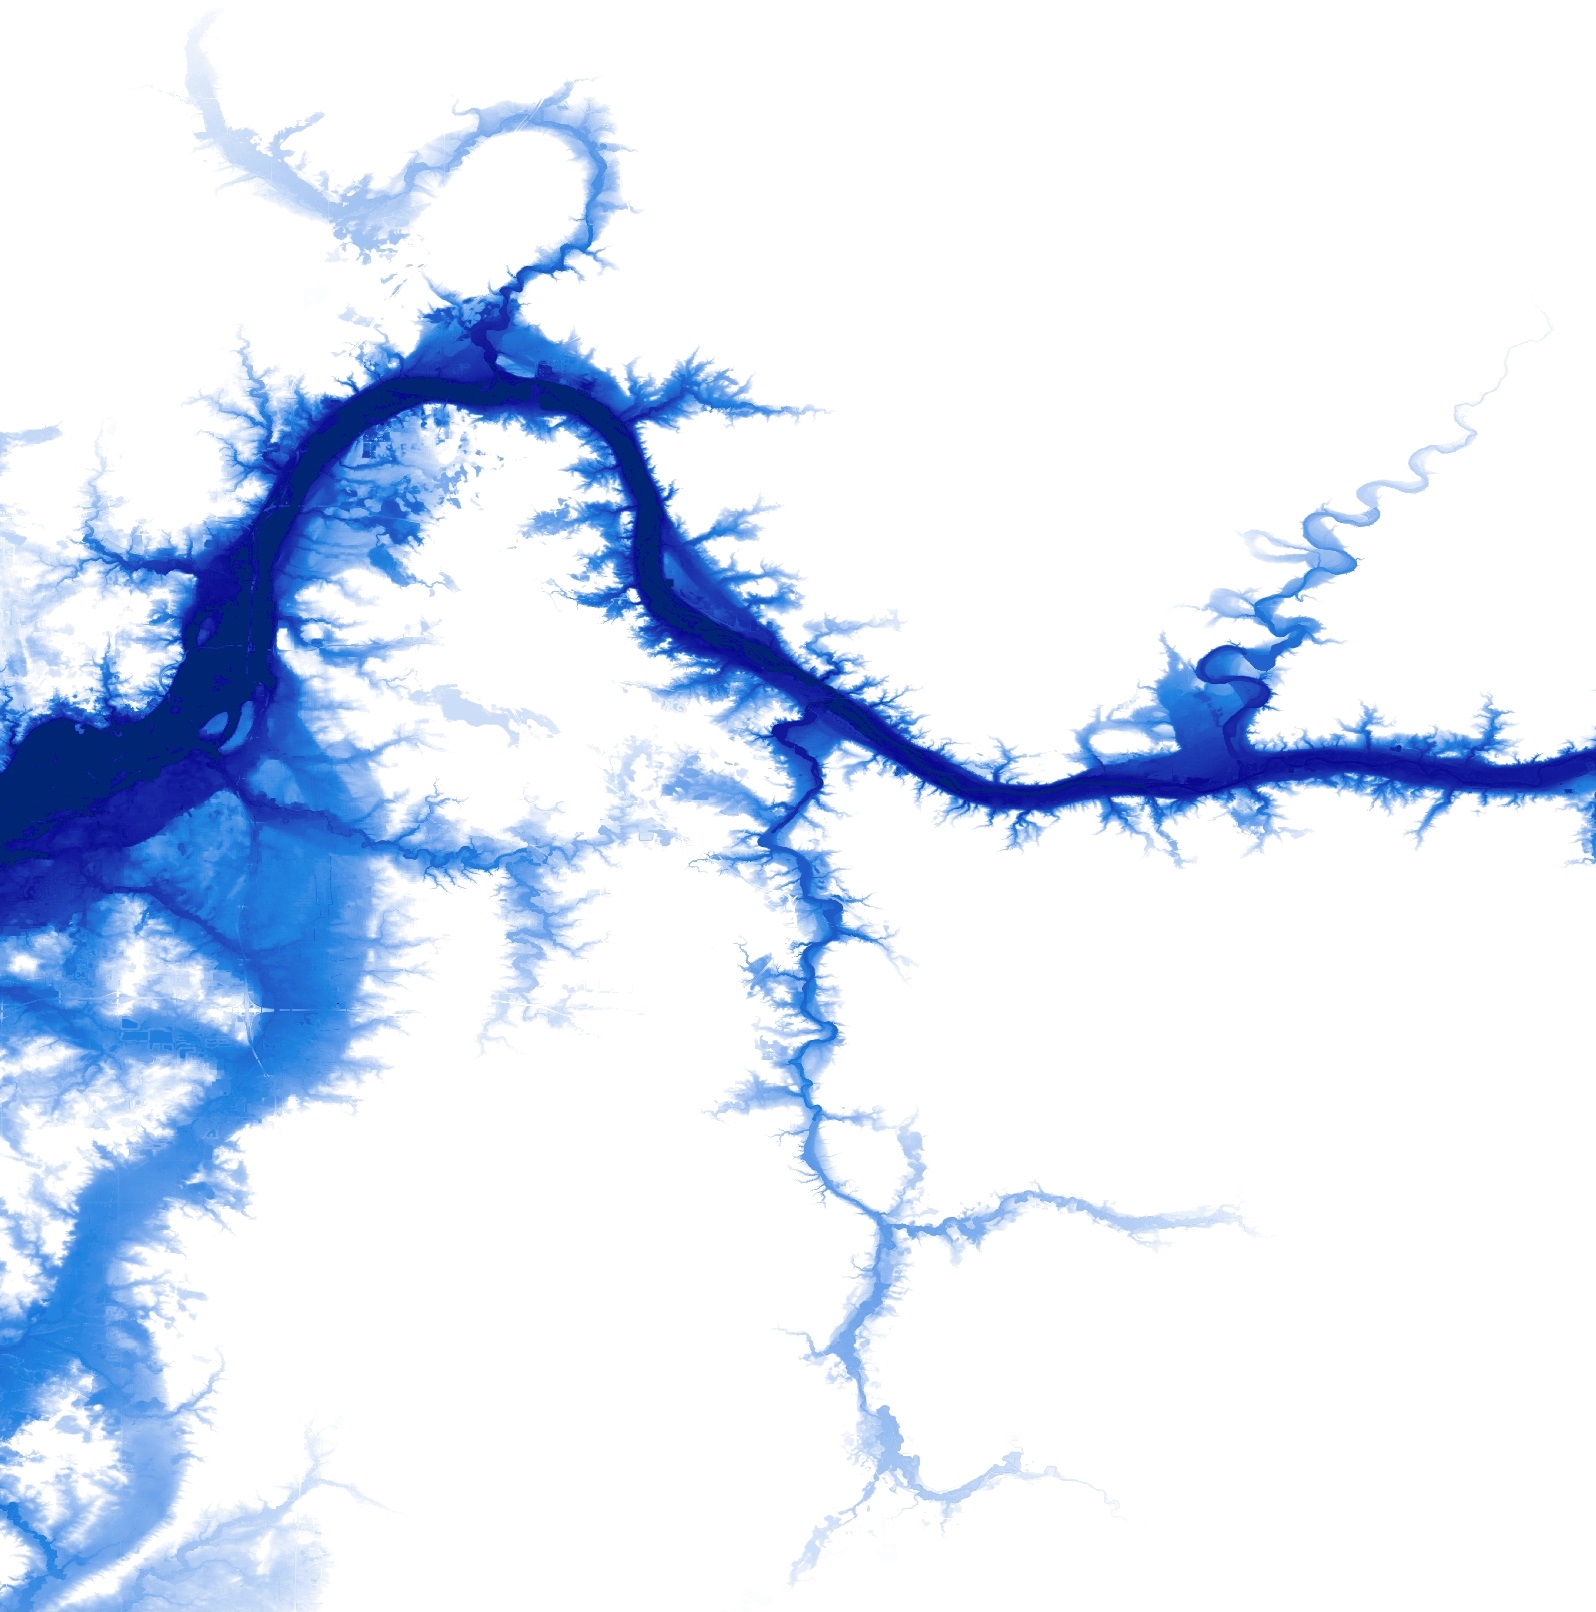
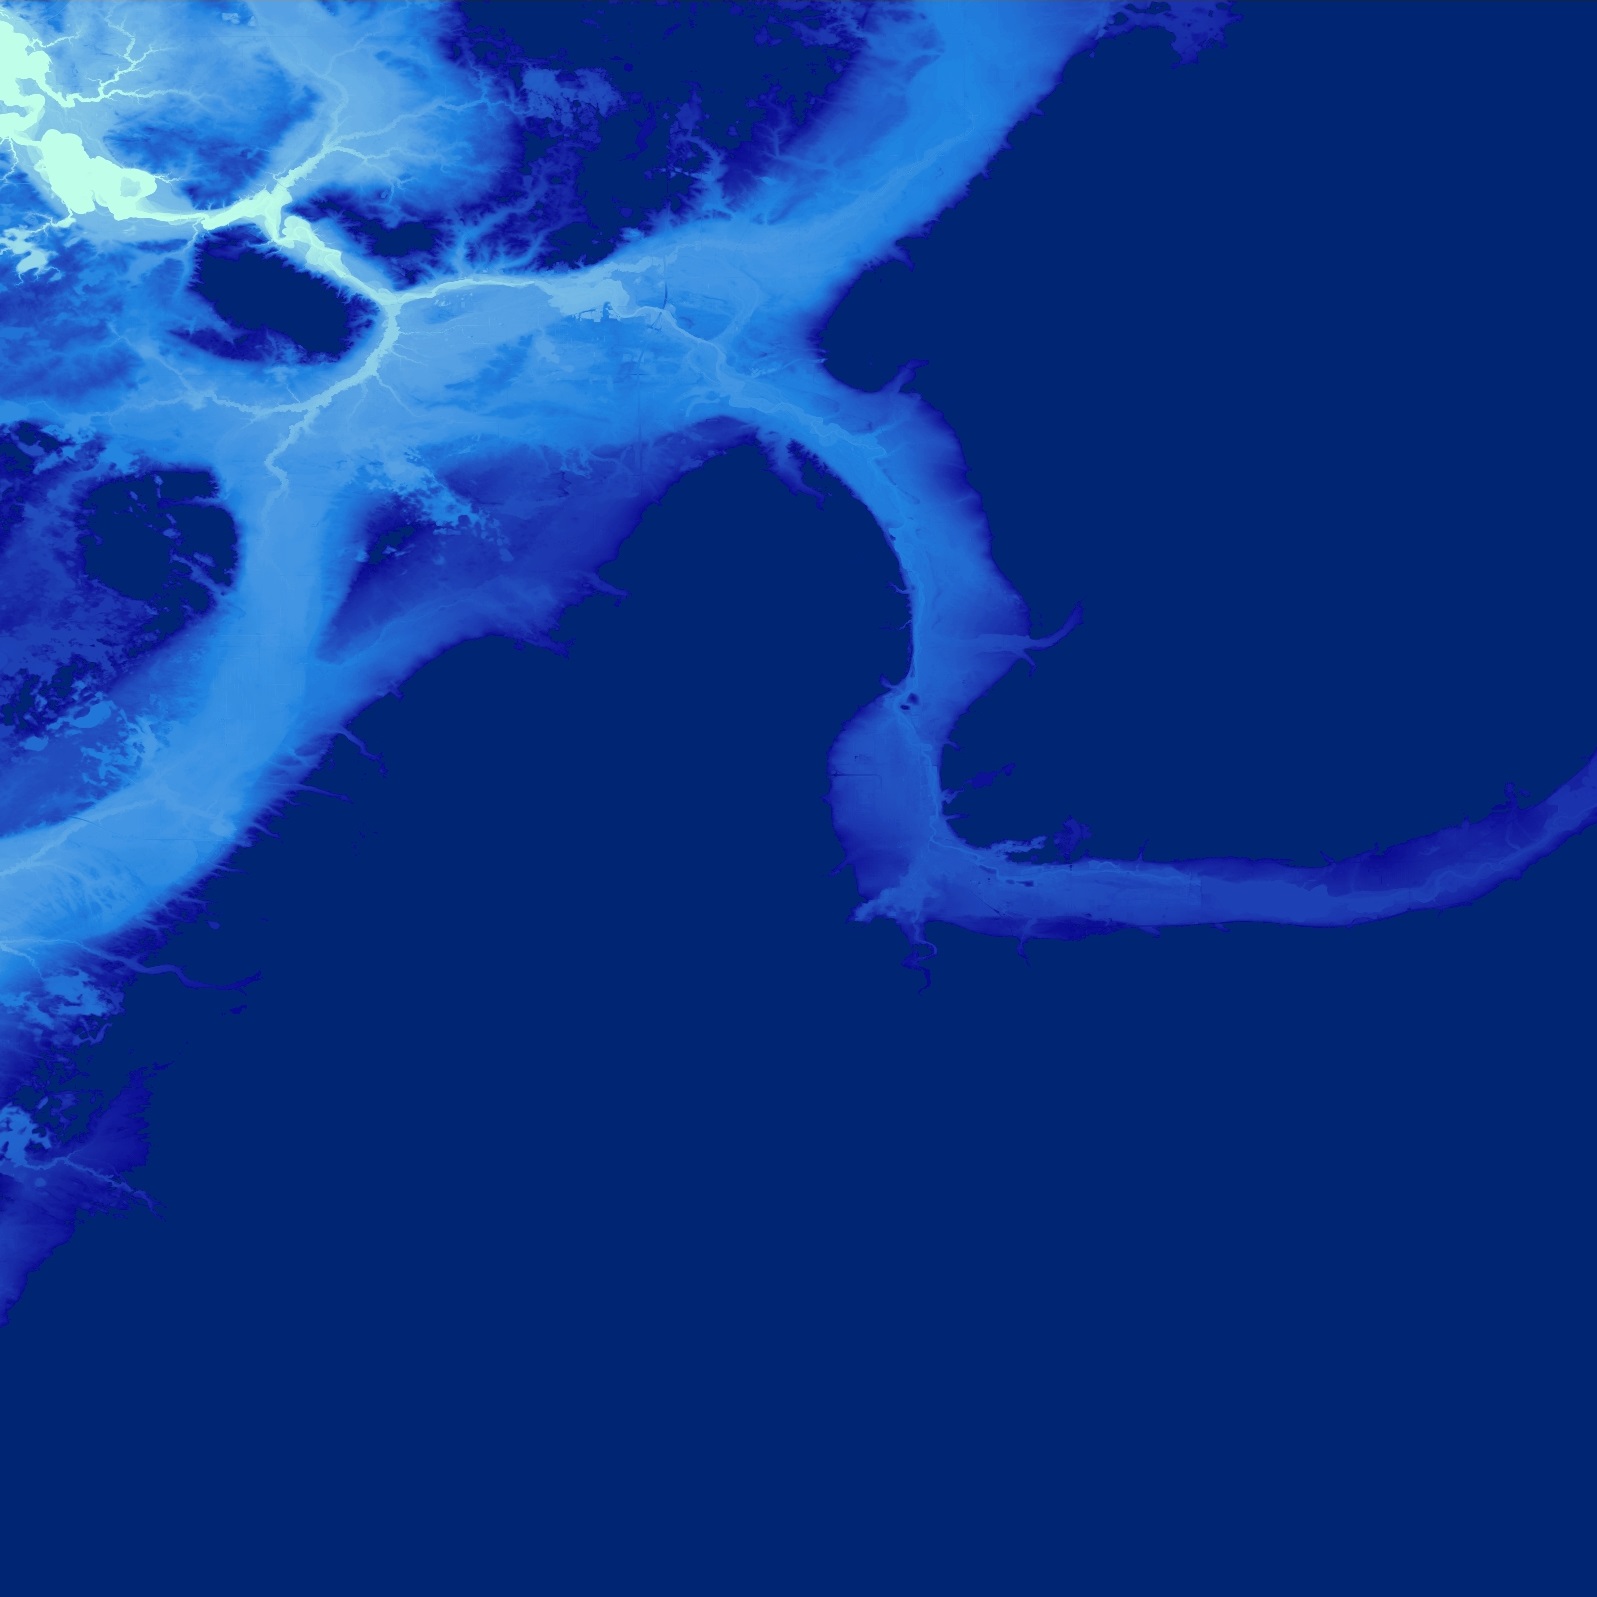
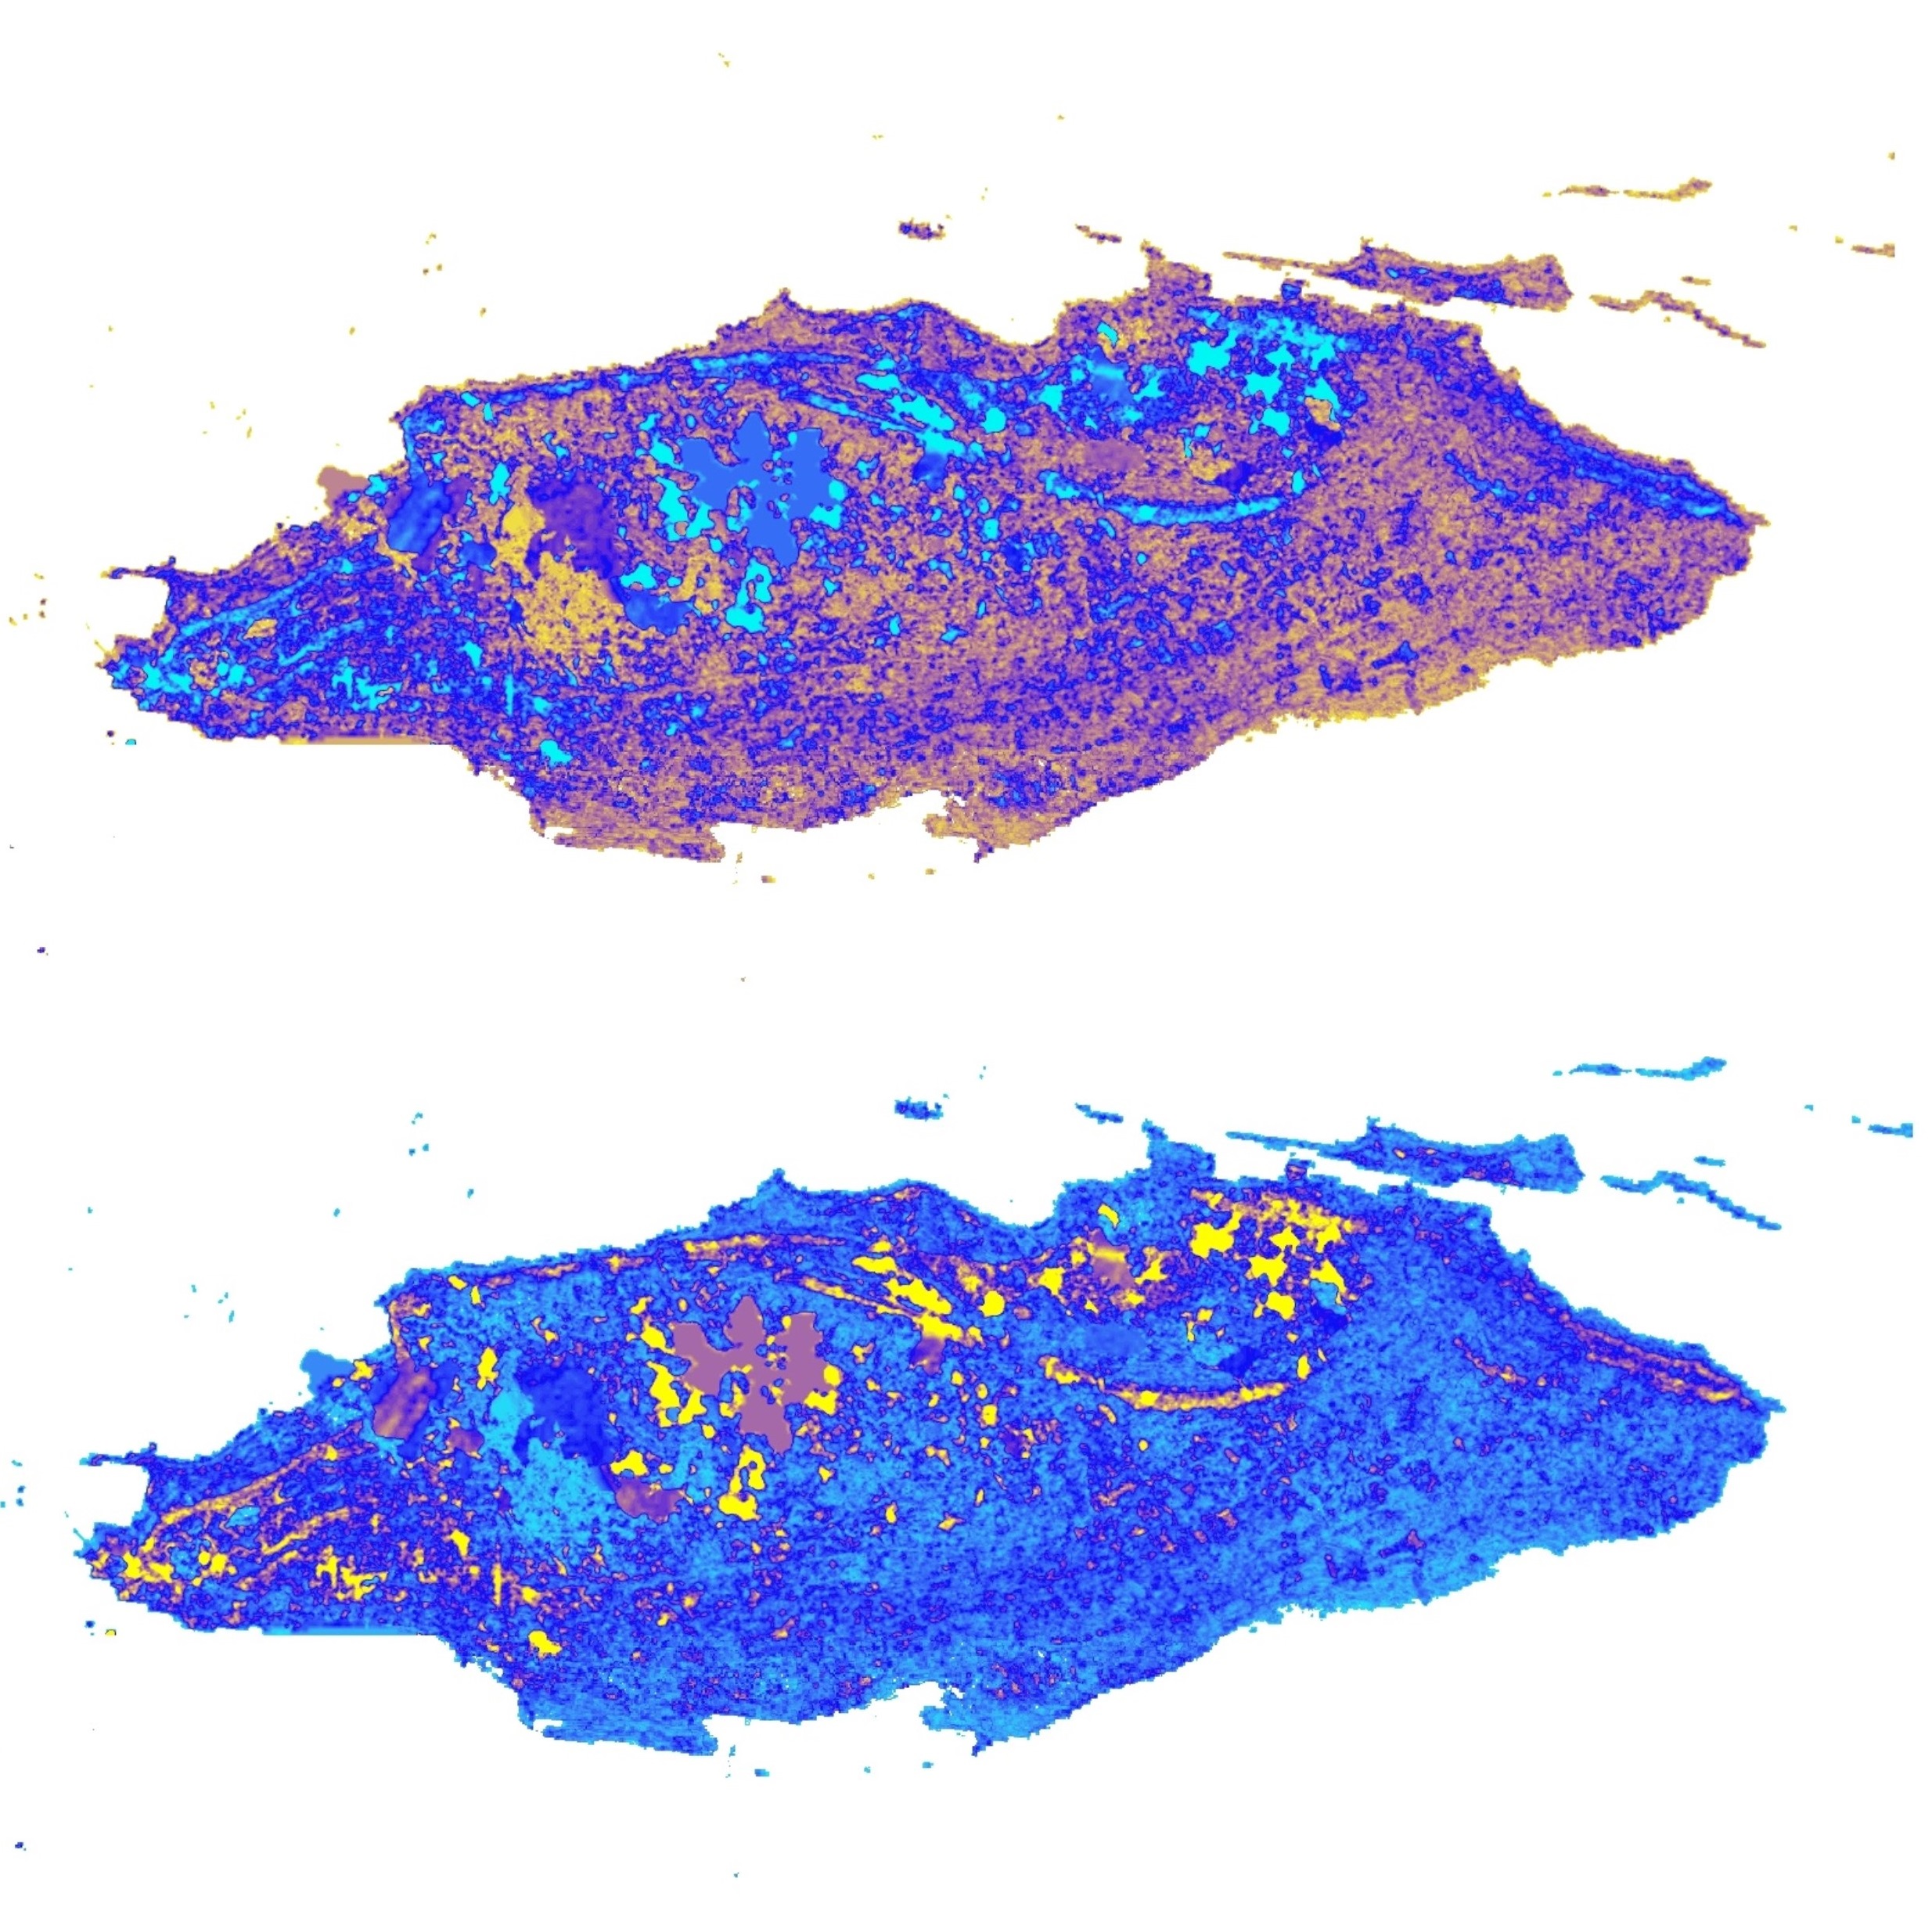
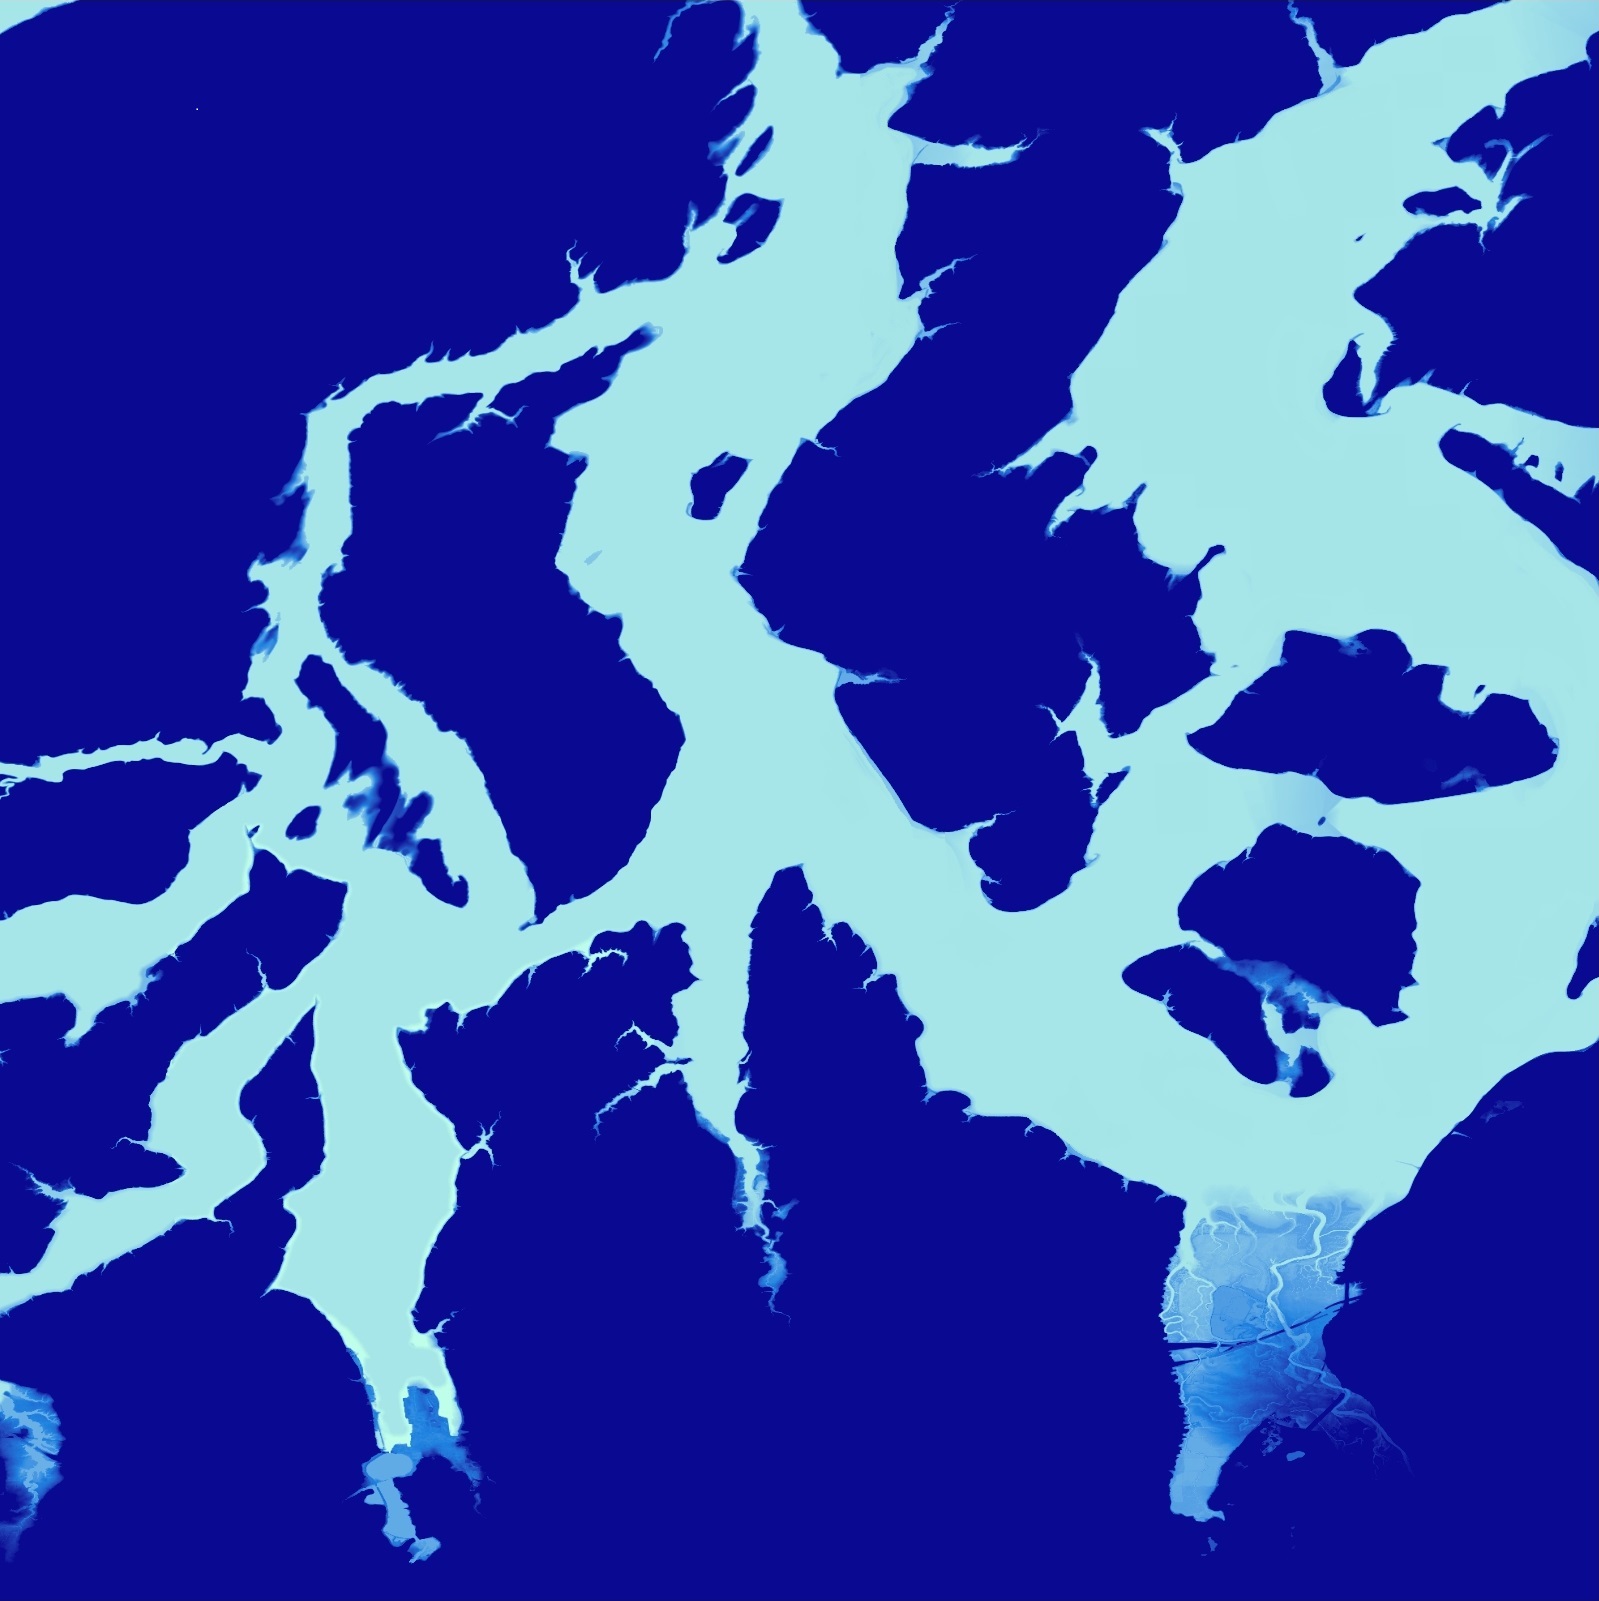
While searching for the right elevation values to symbolize, I was interested in the progression of floodplain depth across the landscape. Below are two series of stills captured as I expanded the range of symbolized elevation values. The Grand River in Michigan (left) is increasing by 5-foot intervals. The Nisqually River Delta in Washington (right) is increasing by 1-foot intervals. I love how these model the movement of water.